US Forest Product Exports to Asia

From the April issue of Biomass Magazine, this data-packed report from Forest2Market suggests existing North American infrastructure can light the way for biomass exporters.
By Stan Parton | March 22, 2017

The industrial wood pellet industry is catching its breath after an astounding surge since the turn of the millennium. Global production of pellets totaled roughly 2 million metric tons (MT) in 2001, and roughly 28 million MT in 2015. As this market continues to evolve globally, it’s a good time to step back and analyze other U.S. forest product exports by region and type. This data can tell us a lot about raw material utilization, and help uncover new opportunities for biomass and wood pellet growth in foreign markets. New demand for industrial wood pellets is on the horizon, as directives from the Paris climate agreement begin to take effect, and Asian markets—particularly the South Korean and Japanese markets—represent new opportunities for U.S. producers.

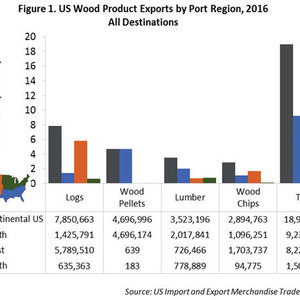
Of the approximately 19 million MT of wood pellets, lumber, logs and wood chips exported from the continental U.S. in 2016, 7.9 million MT (41 percent) were logs (Fig. 1). In total, 5.8 million MT (74 percent) of logs were exported out of the West, 1.4 million MT out of the South, and 0.6 million MT out of the North, to other countries. However, most logs (7.4 of 7.9 million MT) exported out of the U.S. were destined for Asian markets. The majority were exported out of western ports due to the region’s high-quality timber and closer proximity to Asia.

On a volume basis, wood pellets were the next most significant wood product export from the U.S., totaling 4.7 million MT. Over 99 percent of this volume was shipped from the South and received into European ports.

Of the 3.5 million MT of U.S. lumber exports, 2 million MT (57 percent) were shipped via South ports, 0.8 million MT (22 percent) were shipped from North ports and 0.7 million MT (21 percent) were shipped from West ports. Approximately 2.9 million MT of wood chips were exported from the U.S., of which 1.7 million MT (59 percent) were shipped via West ports, primarily to Japan. An additional 1.1 million MT (3 percent) were exported from South ports.

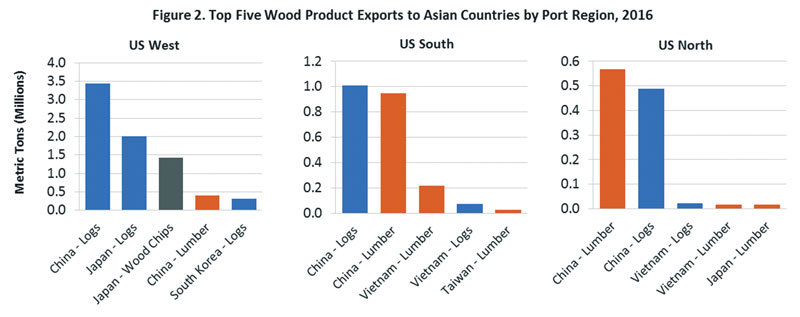
Asian countries are important markets for U.S. wood product exports, especially logs and lumber shipped to China, Japan and Vietnam. For each of the three port regions, log and lumber exports represented the most significant exports to Asian countries in 2016 (Fig. 2). The only exception to this was wood chip exports to Japan out of the West.

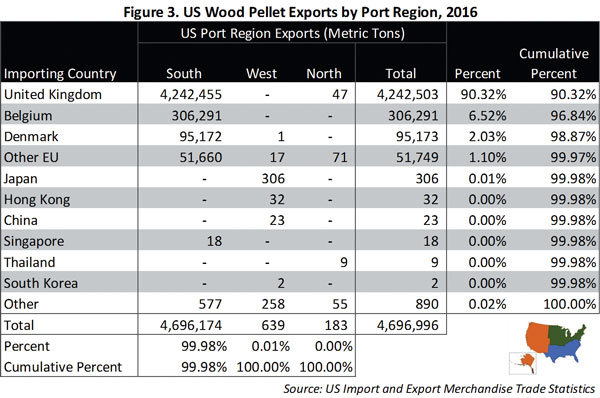
Most U.S. wood pellet exports are shipped to the EU, and more specifically, over 90 percent of all U.S. pellet exports are sent to the U.K. (Fig. 3). Virtually all (99.9 percent) of the 4.6 million MT of wood pellets exported from the continental U.S. are exported through South ports. Not surprisingly, most of the wood pellets exported from the U.S. to Asian countries pass through West Coast ports. While the volume is miniscule compared to South exports to the U.K., at least 309 MT of pellets were shipped to Asian countries in 2016, primarily out of West ports.

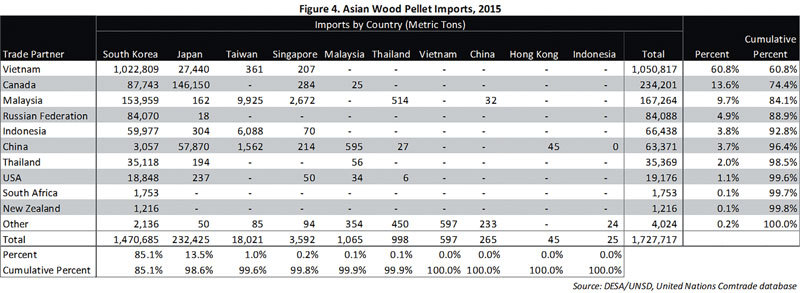
According to United Nations data, the Asian wood pellet import market was approximately 1.7 million MT in 2015 (Fig. 4). By comparison, the U.K. imported 6.5 million MT of pellets during the same period. While the Asian regional market is roughly one-quarter of the size of the U.K. market, the market is young and on a bit of a learning curve.

• The largest Asian pellet importer in 2015 was South Korea, which imported approximately 1.5 million MT, or 85 percent of the Asian market for imported pellets. South Korea imported over 1.0 million MT (70 percent) of its pellets from Vietnam, and an additional 0.4 million MT (29 percent) were imported from Malaysia, Canada, Russia, Indonesia and Thailand. Approximately 18,800 MT of pellets were imported to South Korea from the U.S.

• Japan imported 232,400 MT of pellets in 2015, which represented roughly 13.5 percent of the Asian market. Approximately 146,200 MT (63 percent) were imported from Canada, 57,900 MT (25 percent) were imported from China and 27,400 MT (12 percent) from Vietnam.

• Together, other Asian countries imported approximately 24,600 MT of wood pellets in 2015, primarily from Malaysia (13,100 MT), Indonesia (6,200 MT) and China (2,400 MT).

The Japanese government recently approved nearly 3.2 GW of biomass-fired capacity (approximately 500-plus MW are already commissioned), which represents a new opportunity for global wood pellet manufacturers. Asian biopower producers will require security of supply to ensure financing and ongoing operations and, as evidenced by Canada’s significant exports to Japan, these markets are already receiving high-quality wood pellets from North America. With abundant and sustainable forests and a wood export infrastructure that is already in place as a result of other forest product exports, U.S. biomass and pellet producers are well positioned to capitalize on this increase in demand.


Author: Stan Parton
Bioenergy Practice Manager, Forest2Market
[email protected]
www.forest2market.com


Data Notes:
• All data have been converted from kilograms to metric tons.
• US export data include only vessel (seaborne) trade. In the U.S. export data, “logs” refers to HS code 4403; “lumber” to HS code 4407; “wood chips” to HS code 440121 and 440122; “wood pellets” to HS code 440131.
• Asian wood pellet import data use imports from the Comtrade database for HS code 440131.
• The U.N. Comtrade database reported 18,021 MT of wood pellet imports under the label “Other Asia, nes.” Because the FAOSTAT database reported the same volume associated with Taiwan, we have labeled it as such.
• The data years reported in the U.S. export and Asian import data are different, and, even in the same data year, import and export data may not align perfectly. As such, discrepancies between the export and import data are normal.