Billion-Ton Revisited
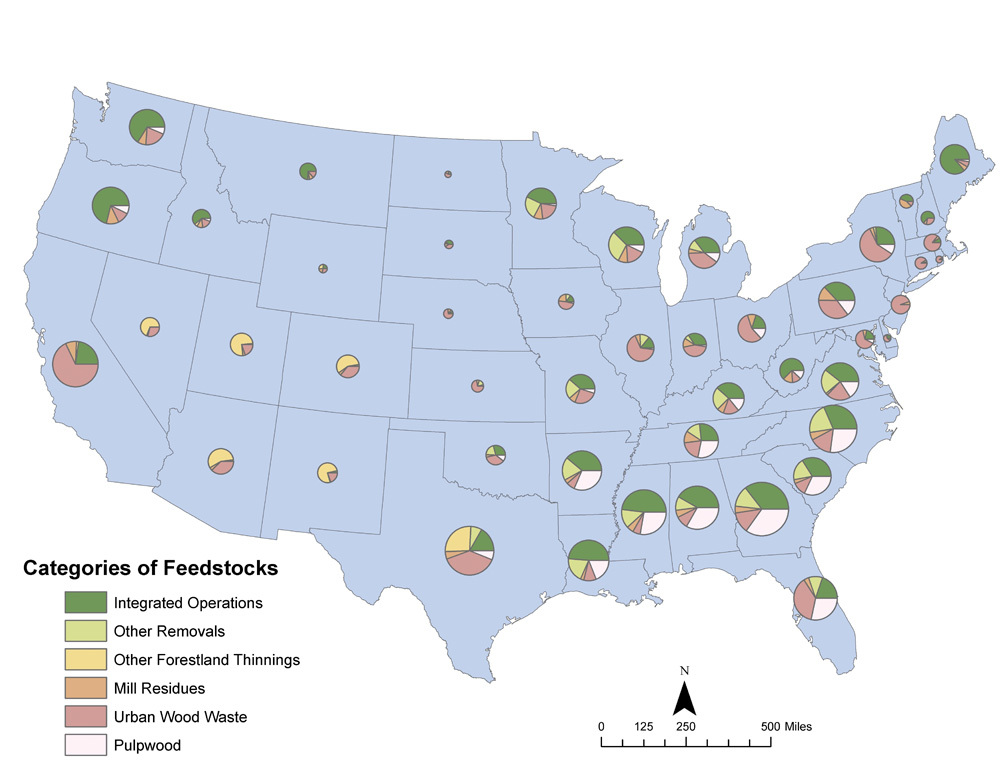
The 2005 U.S. Billion-Ton Study was intended to estimate the biomass potential within the country based upon assumptions regarding then-current production capacity, availability and technology. It provided a starting point for U.S. analysis of biomass as a possible future alternative energy source.
Expanding on the original, the “2011 U.S. Billion-Ton Update: Biomass Supply for a Bioenergy and Bioproducts Industry,” known as the 2011 Billion-Ton Update, included more direct inventory analysis regarding primary feedstocks, focused on price and supply quantities, and conducted rigorous treatment and modeling of resource sustainability, according to the U.S. DOE.
The update evaluated biomass resource potential nationwide and improved upon the 2005 study. The researchers hoped to quantify biomass supply under improved calculations and determine how biomass can be developed for future use.
Understanding the importance of harnessing biomass data, the DOE exhibited a major effort in research for the first study, according to John Ferrell from the DOE’s Biomass Program, and again found the potential for a billion tons of available biomass annually by 2030.
Research and Analysis
Providing the necessary broad depth of expertise to the 2011 study, approximately 50 people provided report research and analysis while a total of 107 people contributed through review and other specialties. The primary research for the update was performed by the Oak Ridge National Laboratory in Oak Ridge, Tenn.
Managed by UT-Battelle, a partnership of the University of Tennessee and Battelle Memorial Institute, the ORNL has a broad portfolio, which includes programs that support the U.S. DOE in scientific discovery and innovation. The ORNL is the DOE’s largest science and energy laboratory.
The update used the lower 48 states as a resource base, excluding Alaska and Hawaii. The forestland resources reviewed included 504 million acres of timberland and 91 million acres of other forestland. The agricultural resource base included 340 million acres of cropland, 40 million acres of idle cropland and 404 million of pasture.
The study used scientific modeling methods to determine current agricultural and woody biomass availability and also projected the supply to 2030. Robert Perlack, senior scientist at ORNL, says the Policy Analysis System (Polysys), an economic modeling simulator developed by the University of Tennessee, was used to estimate supply curve quantities and prices. The system operates at a county level and is supported by the USDA’s 10-year data projections extended to 2030.
The update provided quantities based on two scenarios, the baseline, providing conservative calculations, and a high-yield scenario showing full potential. Focusing on more than just quantities, the update integrated environmental measures to ensure sustainability and also analyzed cost information and productivity, according to Perlack.
Under the baseline scenario, for example, the current national corn yield is 160 bushels per acre, while the yield is projected at 201 bushels per acre in 2030. This assumes energy crop yields increase 1 percent annually, which is attributable to the growth of industry experience in planting energy crops, Perlack says.
Using the accelerated high-yield scenario, national average corn yields would increase to 265 bushels per acre in 2030 based upon the assumption of higher amounts of cropland in no-till situations to allow greater residue removal. Perlack says the study assumed energy crop yields would increase at up to 4 percent annually.
The researchers reviewed forest and agricultural resources as feedstocks in the 2011 study, according to Bryce Stokes from CNJV, a company that provides engineering research services to the DOE. CNJV is a joint venture between Corporate Allocation Services Inc. and Navarro Research and Engineering Inc.
Forestry feedstocks included a composite group (a combination of logging residues and forest thinnings), conventional and fuel wood, primary and secondary mill residues, urban wood residues, and pulping liquors. On the agricultural side, the study quantified crop residues, grains to biofuels, perennial grasses and woody crops, animal manures, food/feed processing residues, municipal solid wastes and landfill gases, and annual energy crops.
Algae potential was not reviewed in the update. It was considered as an addition to the study approximately two years ago, and at that time, and even today, the researchers determined they could not perform a sufficient analysis of potential algae contributions due to insufficient data, according to Stokes. Other assessments, however, have been done on algae including the DOE’s National Algal Biofuels Techonology Roadmap, which can be found at www.1.eere.energy.gov/biomass/pdf/algal_biofuels_roadmap.pdf, and the National Microalgae Biofuel Production Potential and Resource Demand study done by Wigmosta, Coleman, Skaggs, Huesemann, and Lane, and referenced at https://bioenergykdf.net/node/322.
Differences From 2005
With a sustainability component and more directed approach in 2011, the conservative results may show more accurate projections of what the industry can expect from biomass availability compared to 2005.
In 2005, the study provided national estimates, however it lacked analysis on focused spatial information and cost analysis. Environmental sustainability was addressed from a national perspective. The study estimated current availability and then broad-sweeping, long-term projections, 2025 through 2050, involving changes in productivity, efficiency and land use.
By contrast, in 2011, a more systematic approach was taken with county-level analysis aggregated to state, regional and national levels. A more focused modeling of environmental sustainability was used for residue removal. Logically, updated data, the 2009 USDA agricultural baseline and 2007 forestry timber product output database specifically, was used as a starting point for the update. The timeline for the project was 2012 through 2030 with annual projections based on continuation of the baseline trends.
In particular, the update separated feedstocks into “used” and “potential” categories to differentiate the biomass the nation was not yet utilizing. “In the 2005 study, feedstocks currently used for energy production or [that] could be shifted from another market to energy production were counted in the biomass potential,” according to the 2011 study. “In the update, the currently used biomass is clearly delineated from the potential.”
Researchers involved in the 2011 study made a concerted effort to review cost assumptions that include compliance with statutes, regulations and best management practices. For agricultural feedstocks, the study explicitly modeled crop residue retention, tillage, nutrient replacement and crop rotation to provide erosion protection and maintenance of soil organic carbon. Researchers included only accessible forestry feedstock, meaning little to no road building was anticipated and forestry-related feedstocks located on steep slopes were not included.
The major difference came from the modeling of energy crop potential at a county-level using Polysys in 2011. All estimates for energy crops assume that demands for food, feed, and exports continue to be met, according to the 2011 study.
As the overall 2011 results showed, forest residue potential is less, compared to 2005, due to a decline in pulpwood and sawlog markets, removal of unused resources from review, and because the researchers were much more careful in separating used from potential forestry resources, according to Perlack.
On the agricultural side, the total crop residue availability is less, due to consideration of soil carbon issues and the preclusion of residue from conventionally tilled acres. Energy crops, however, showed much more potential, Perlack notes, with the addition of pastureland in the model, unlike the 2005 study.
Emergence of Energy Crops
Showing significantly different results than 2005, the update provided a current baseline scenario supply of 473 million dry tons-per-year with 45 percent consisting of currently used resources and the remainder being potential additional biomass. By 2030, there are estimated resources annually of 1.1 billion dry tons, consisting of 30 percent used and 70 percent potential biomass.
For the high-yield scenario, total resources range from nearly 1.4 billion to more than 1.6 billion dry tons annually by 2030, of which 80 percent is potential additional biomass. The update found that enough resources exist to meet the 2022 advanced biofuel goals, that potential resources are widely distributed across the nation, and planned energy crops are the single largest source of new feedstock potential.
The dedicated crops showed increased potential in the update, however, because of the focus on sustainability restrictions in the modeling process. The restraints included integrating best management practices, not allowing energy crops on irrigated cropland or pasture, and allowing only 10 percent of cropland and 25 percent of all lands within any one county to be used.
Perlack says that the results show a lot of potential for dedicated energy crops, and added that they are grown where the land is available, including areas with large quantities of pastureland in the great plains and southern plains regions of the U.S. The crops reviewed were perennial grasses including switchgrass, woody crops (eucalyptus, southern pine, poplar and willow) and annual energy crops such as sorghum.
Ferrell says the largest single resource, as time goes by, are the purpose-grown energy crops, which could be seen as an extension of the current farm system. He adds that the update is extremely important to the agricultural and forestry industries and landowners should be able to increase profits and create jobs.
Bioenergy KDF
To maintain the 2011 update as a living, breathing document, the DOE created the Bioenergy Knowledge Discovery Framework (KDF), an extensive online tool kit available for industry professionals, researchers, policymakers and the public. For someone interested in pursuing their own high level of analysis of focused information, the KDF is the place to search, Perlack says.
For professionals, the KDF provides the latest research data on biomass feedstock production and supply projections to identify business opportunities. For researchers, laboratories and academia, the KDF allows focused exploratory analysis and modeling.
The public can gain much-needed education about biomass and feedstock availability nationwide using the operator-friendly website. Policymakers can utilize the site to make strategic decisions at the federal, state and local levels, according to the DOE.
Aaron Crowell from BCS Inc., a company that provides technical and engineering services to the DOE, says individuals can use the KDF to download report data, aggregate reports and complete high-level data sets.
The KDF’s modeling page includes an easy-to-use data explorer that can be used to focus on specific information regarding feedstocks, projections to 2030, prices, type of spatial data such as production, and location (county or state level). Once the model is run, one should be able to look at the spatial data for the specific factors chosen, according to Crowell.
The KDF also includes forums that allow discussions with authors and contributors. The KDF modeling system can be found at www.bioenergykdf.net.
Author: Matt Soberg
Associate Editor, Biomass Power & Thermal
(701) 746-8385
[email protected]